
Quanser Mechatronics Sensors Trainer USB Time of Flight Page
The Quanser Mechatronics Sensors Trainer USB Time of Flight Page plots a bar chart showing the distance from each zone of the VL53L8CHV0GC/1 time of flight sensor. The height of each bar is representative of distance. The sensor may be configured into zones organised in a 4x4 grid or an 8x8 grid. The page is displayed below with a sample plot for an 8x8 grid of zones.
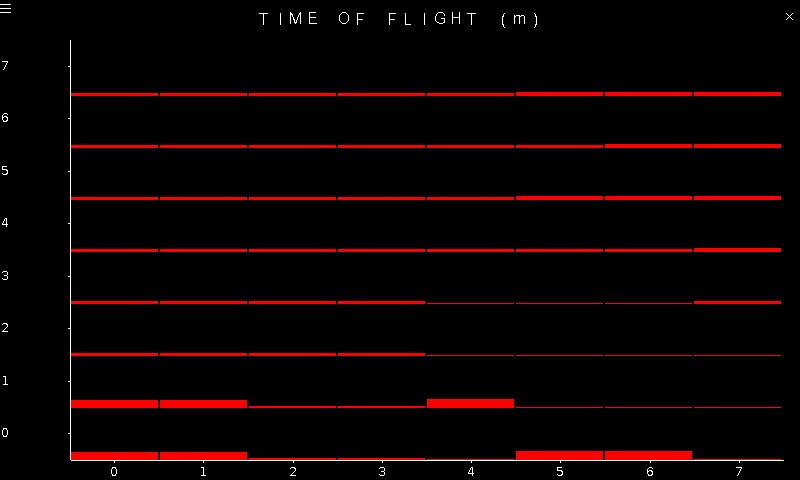
To go back to the Sensors page, tap on the close button in the top, right corner of the page. To change the sensor parameters, tap on the hamburger menu in the top, left corner of the page. This will open the settings screen described in the section below.
The accuracy of the readings depends on the target reflectance. Note that the time of flight sensor can measure distances from about 20 mm to 4 meters. The sensor has a relatively wide field of view so when experimenting with the sensor for the first time it is best to point it at a wall.
Settings
The settings page is illustrated below:
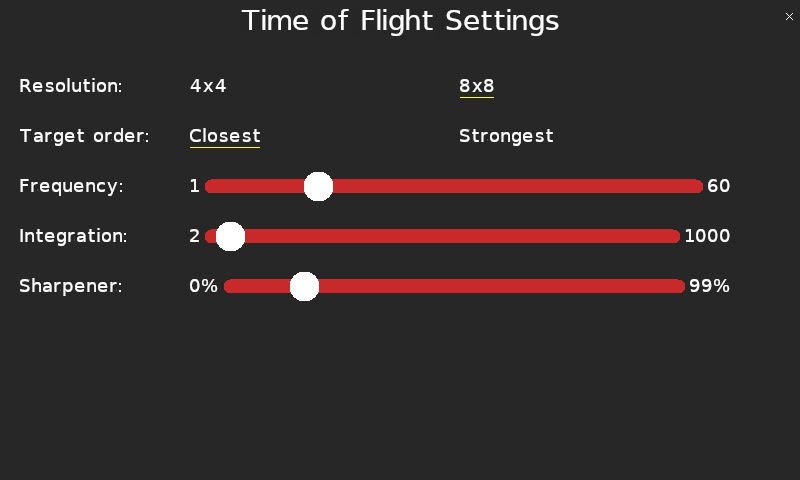
The time of flight sensor supports either 4x4 resolution or 8x8 resolution, selectable via the Resolution parameter. The plot will change to reflect the resolution chosen.
The Target order parameter determines whether the time of flight sensor responds to the closest target in each zone or the strongest target in each zone.
The sampling frequency of the sensor may be configured using the Frequency slider. When the resolution is 4x4, any sampling frequency from 1 Hz to 60 Hz may be selected. When the resolution is 8x8, the sampling frequency will be limited to 15 Hz when the settings screen is closed.
The integration time controls the amount of time the sensor spends collecting photons in its SPAD array. The Integration slider determines the integration time with values ranging from 2 milliseconds to 1000 milliseconds. Clearly the sampling frequency should be low enough to encompass the integration time.
The Sharpener slider determines how much a sharpening algorithm is applied to improve the results. A reasonable value is 14%.
Tap the close button in the top, right of the page to apply the new settings and return to the plot.
Copyright ©2026 Quanser Inc. This page was generated 2026-05-13. Submit feedback to Quanser about this page.
Link to this page.