
Quanser Mechatronics Sensors Trainer USB Gyroscope Page
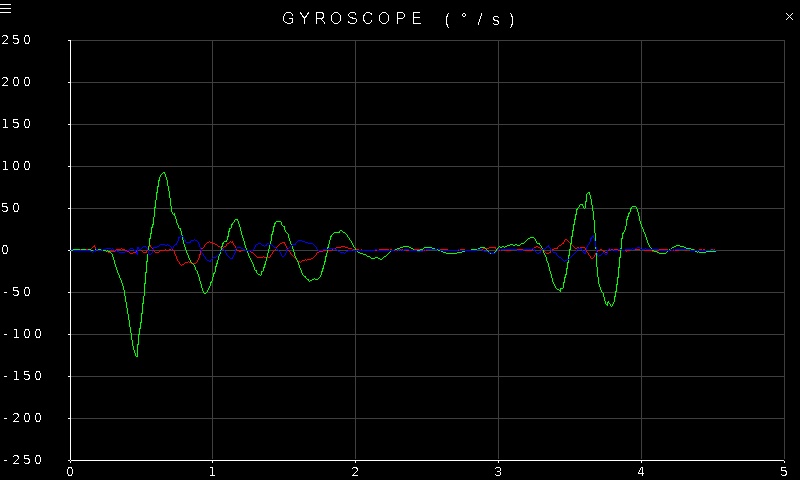
The Quanser Mechatronics Sensors Trainer USB Gyroscope Page plots the angular velocities measured by the gyroscope of the ICM20948 inertial measurement unit (IMU) in degrees per second. It plots the X, Y and Z axes of the three degree of freedom gyroscope. The page is displayed below with a sample plot, showing the X axis in green, Y axis in red and the Z axis in blue.
To go back to the Sensors page, tap on the close button in the top, right corner of the page. To change the sensor parameters, tap on the hamburger menu in the top, left corner of the page. This will open the settings screen described in the section below.
The readings from the sensor have 16 bit resolution. Note that the gyroscope can measure up to ±2000 degrees per second. The plot axes are fixed but are adjusted to match the full scale range of the gyroscope.
Settings
The settings page is illustrated below:
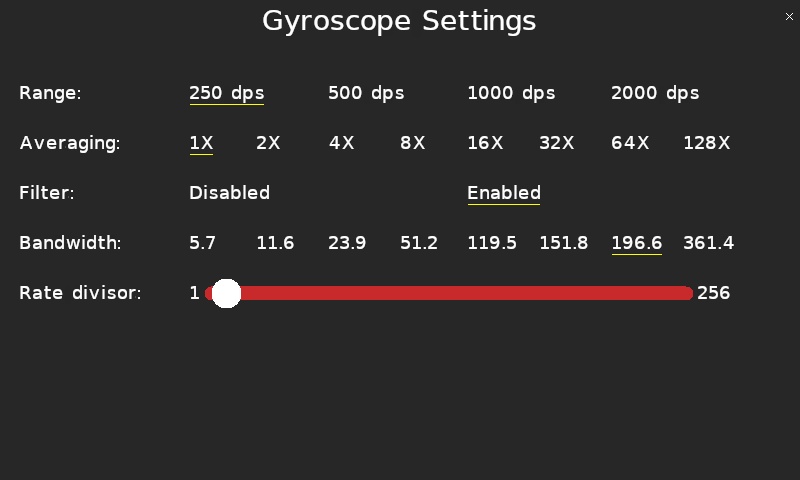
The gyroscope supports four different full scale ranges: 250, 500, 1000 and 2000 degrees per second. The current range will be underlined. Tap on the desired range in the Range row to select a new full scale range.
Since gyroscope measurements can be noisy, the gyroscope supports both averaging of the signal using oversampling as well as low pass filtering of the signal. The Averaging parameter allows the desired oversampling to be selected, from 1X to 128X oversampling. Higher oversampling will reduce the noise but will add more lag to the measurement. Low pass filtering may be enabled or disabled using the Filter parameter. This does not affect the oversampling. Use an oversampling of 1X to disable oversampling. Use the Bandwidth parameter to select the low pass filter bandwidth in Hertz.
The Rate divisor setting determines the output data rate of the sensor. A rate divisor of 1 corresponds to 1.125 kHz, while a rate divisor of 256 corresponds to 4.39453125 Hz when filtering is enabled. When filtering is disabled the maximum rate is 9 kHz.
Tap the close button in the top, right of the page to apply the new settings and return to the plot.
Copyright ©2026 Quanser Inc. This page was generated 2026-05-13. Submit feedback to Quanser about this page.
Link to this page.