
Quanser Mechatronics Sensors Trainer USB GUI
The Quanser Mechatronic Sensors Trainer USB device provides an extensive GUI for experimenting with and controlling the device. There are two primary pages to the GUI called the Sensors (Page 1) and the Sensors (Page 2). To get to these pages from the home page shown below:
press and hold the Joystick button while simultaneously swiping down from the top, centre of the home page. This sequence was chosen so that it would be unlikely to interfere with usage of the touch panel for other purposes. While swiping down from the top of the home page, the Sensors (Page 1) will slide into view. This page is illustrated below:
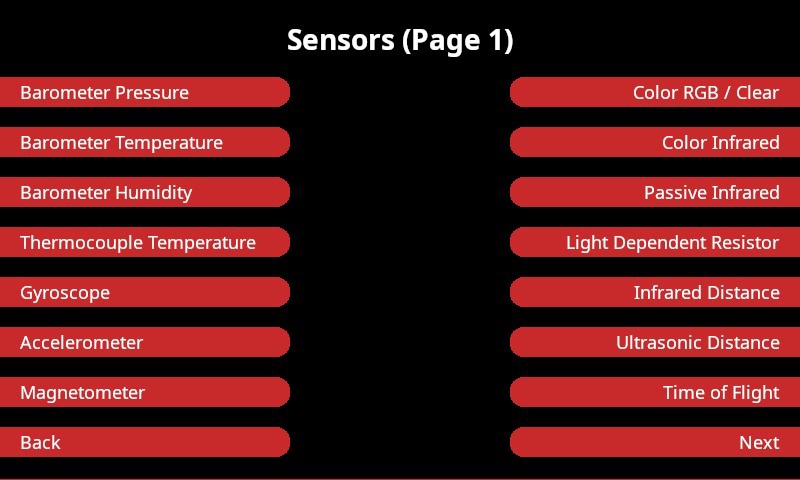
This page provides access to further pages to experiment with and control about half the sensors available on the device. Once this page is visible, it is no longer necessary to hold the Joystick button.
Swiping down from the top, centre of the Sensors (Page 1) will cause the Sensors (Page 2) to slide into view. This page is displayed below:
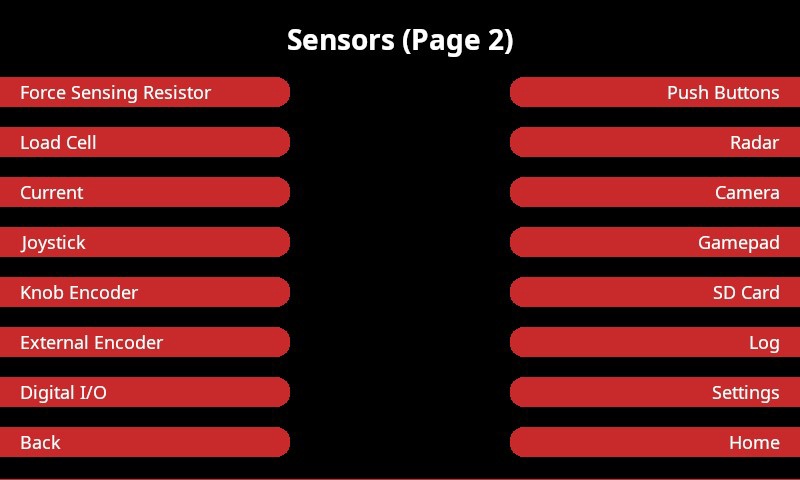
This page provides access to the rest of the sensors on the device, as well as some additional functionality for the gamepad support, SD card, log and global settings.
Tapping on any of the red buttons will bring up additional pages specific to the respective sensor or functionality. For a sensor, this typically means that a plot will be displayed showing the data currently being measured from that sensor. Plotting is discussed in more detail in the subsection below.
The Back and buttons at the bottom of the Sensors pages may be used to navigate between the two pages if preferred. The Home button at the bottom of the Sensors (Page 2) page returns the display to the home page. It is also possible to swipe up and down from the top or bottom of the page, as appropriate, to go between the three pages.
Plotting and Settings
The data from almost all the sensors may be plotted on the device itself. Plots currently have fixed axes. A sample plot is depicted below:
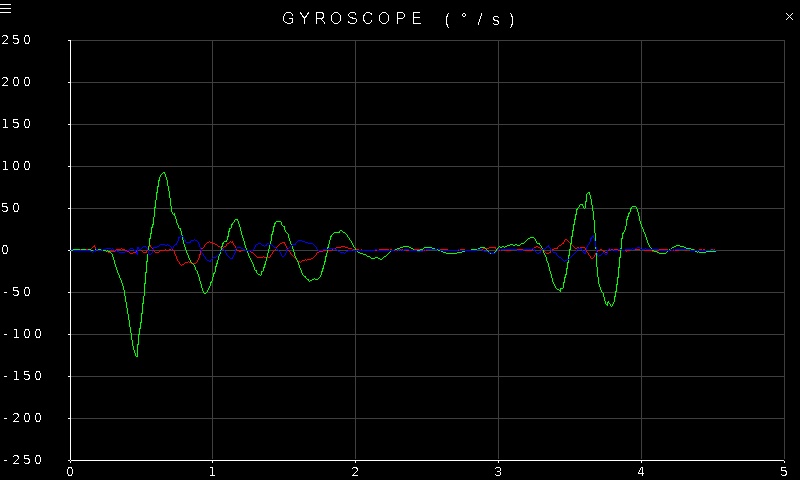
Notice that there are two buttons at the top of the page. There's a close button on the top, right, which appears as a simple X symbol, and there is a settings button on the top, left which appears as a "hamburger" menu (three stacked lines). Tapping the close button closes the plot and returns to the original Sensors page. Tapping the settings button opens a settings screen which allows various properties of the sensor to be reconfigured. If there is no settings button, then that particular sensor has no parameters to reconfigure. The settings screen for the gyroscope is shown below:
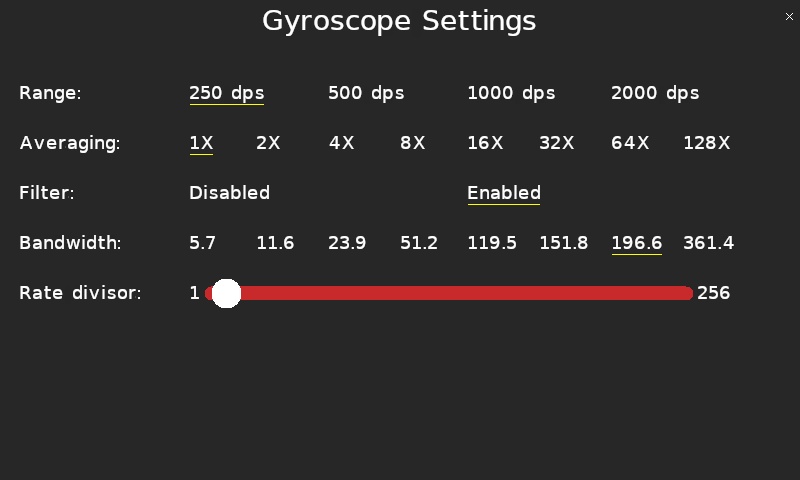
Note that a settings screen also has a close button in the top, right. Tapping the close button will return to the plot with the new settings in effect.
Settings with a fixed number of options will be shown with the current setting underlined. For example, in the image above, the current gyroscope range is set to 250 degrees per second. Tapping on one of the other ranges will change the current selection and reconfigure the full scale range of the gyroscope sensor.
Slider values may be changed by pressing on the slider knob and sliding one's finger back and forth. It is also possible to simply tap at the location where you wish the knob to be. In that case, the knob will jump to the tapped location. Pressing and holding one's finger at a specific location and then sliding back and forth from there will cause the slider knob to jump to that location and start tracking your finger. The minimum and maximum values of the slider range are shown at either end of the slider.
Copyright ©2026 Quanser Inc. This page was generated 2026-05-13. Submit feedback to Quanser about this page.
Link to this page.