
Quanser Mechatronics Sensors Trainer USB Colour Infrared Page
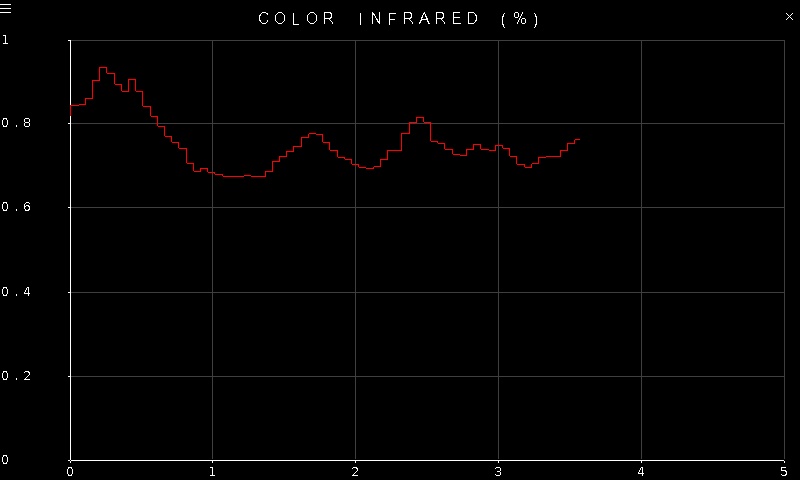
The Quanser Mechatronics Sensors Trainer USB Colour Infrared Page plots the infrared colour component measured by the VEML3328 colour sensor. It plots the infrared colour as a fraction between zero and one. The page is displayed below with a sample plot, showing the infrared colour component in red.
To go back to the Sensors page, tap on the close button in the top, right corner of the page. To change the sensor parameters, tap on the hamburger menu in the top, left corner of the page. This will open the settings screen described in the section below.
The readings from the sensor have 16 bit resolution. The plot axes are fixed. Note that colour sensing does better in bright illumination. Hence, the settings page allows the illumination to be controlled via LEDs surrounding the sensor.
Settings
The settings page is illustrated below. Note that this settings page is shared with the colour RGB / clear sensor.
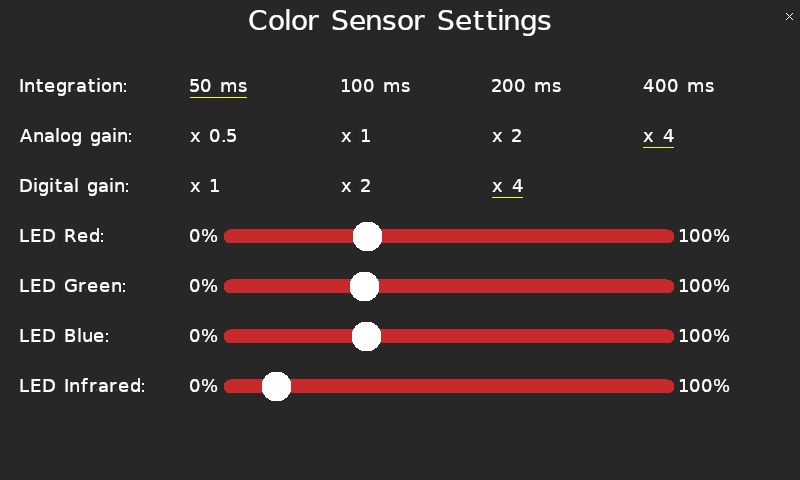
The Integration parameter allows the integration time of the sensor to be configured. A larger integration time may improve the sensitivity of the measurement but increases the lag. Changing this value will affect the colour RGB / clear sensors as well.
The Analog gain allows the amplification of the analog colour signal to be configured, up to 4X amplification. The sensor also supports a Digital gain of up to 4X amplification. Changing these values will affect the colour RGB / clear sensors as well.
The LED Infrared slider allows the illumination surrounding the colour infrared sensor to be controlled. Set the slider to 0% to turn off the LED. Set it to 100% to get the maximum illumination. Illumination is recommended when measuring infrared. However, the infrared LEDs are quite powerful, so a small value, such as 10%, is recommended.
Tap the close button in the top, right of the page to apply the new settings and return to the plot.
Copyright ©2026 Quanser Inc. This page was generated 2026-05-13. Submit feedback to Quanser about this page.
Link to this page.