
Quanser Mechatronics Sensors Trainer USB Barometer Temperature Page
The Quanser Mechatronics Sensors Trainer USB Barometer Temperature Page plots the temperature measured by the BME280 weather sensor in °C. The page is depicted below with a sample plot:
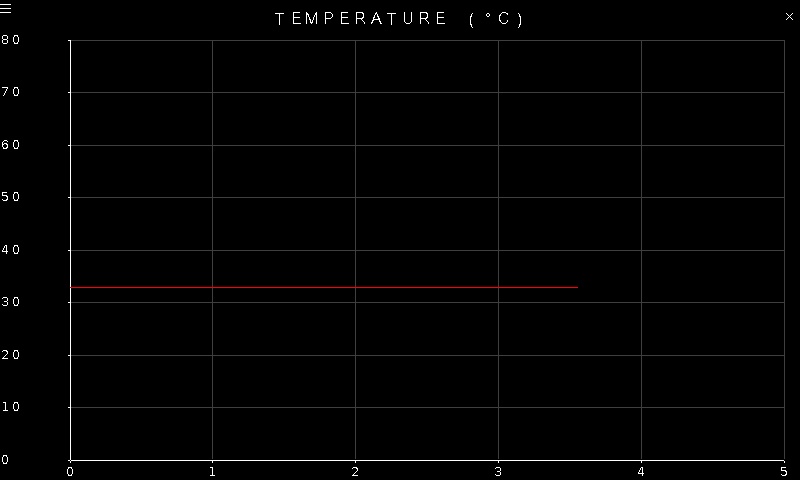
To go back to the Sensors page, tap on the close button in the top, right corner of the page. To change the sensor parameters, tap on the hamburger menu in the top, left corner of the page. This will open the settings screen described in the section below.
Settings
The settings page is common to the pressure, temperature and humidity provided by the BME280 weather sensor. The settings are illustrated below:
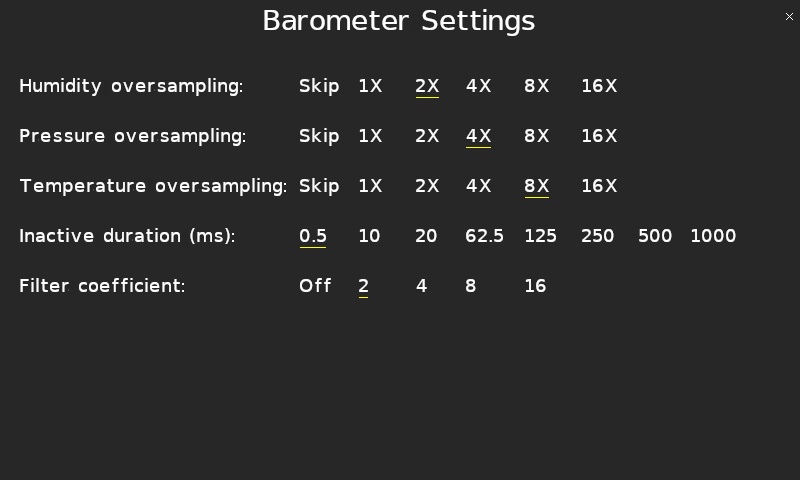
To skip the temperature measurement, set the Temperature oversampling to Skip. Otherwise set it to one of the oversampling options to both enable the temperature measurement and determine the amount of oversampling performed. Higher oversampling will reduce the noise but will add more lag to the measurement.
There is also an IIR filter that may be enabled for the temperature measurement. To disable the IIR filter, set the Filter coefficient to Off. Note that this setting will affect the pressure measurement as well. When the IIR filter is disabled, the effective temperature resolution is:
16 + (OSR - 1)
bits, where OSR is the log2 of the Temperature oversampling factor. For example, for 8X oversampling, OSR = log2(8) = 3 and the effective resolution is 16 + (3 - 1) = 18 bits.
When the IIR filter is enabled, the effective temperature resolution is 20 bits. The IIR filter computes the output for the next measurement using the following formula:
filtered output = (previous filtered output * (filter coefficient - 1) + ADC reading) / filter coefficient
where the "filter coefficient" is the value specified in Filter coefficient setting. The higher the filter coefficient, the slower the response time. For example, if there is a step input in temperature, the number of samples required to reach 75% of the step response is outlined in the following table:
|
Filter coefficient |
Samples to reach 75% of step response |
|---|---|
|
Filter off |
1 |
|
2 |
2 |
|
4 |
5 |
|
8 |
11 |
|
16 |
22 |
The Inactive duration setting determines the output data rate of the sensor. It is the time between readings and affects the pressure, temperature and humidity readings.
Tap the close button in the top, right of the page to apply the new settings and return to the plot.
Copyright ©2026 Quanser Inc. This page was generated 2026-05-13. Submit feedback to Quanser about this page.
Link to this page.